Resume the A shares in 2018
Original title: Resume A shares in 2018

Image source: vision china
Text | Suning Wealth Information, Author | Wang Chen, Gu Huijun
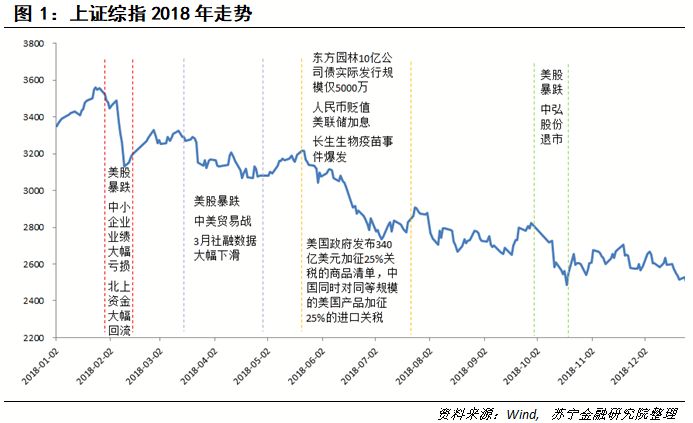
Looking back on 2018, under the influence of a series of internal and external factors, such as "deleveraging" and "US dollar interest rate hike", A shares began to fall all the way from February to the end of the year, which can be described as miserable (see Figure 1). Below, this paper makes a resumption of the stock market in 2018 from four aspects: valuation, performance, capital and market sentiment, to help investors take care of the present and future of A shares.
Valuation: Looking at the historical low vertically, looking at the global depression horizontally.
We analyze the valuation of A shares based on a dimension of 2 (index, industry) ×2(PE, PB).
PE of main index of a shares:By analyzing the historical PE data of Shanghai Composite Index, Shenzhen Stock Exchange Index, Shanghai Stock Exchange 50, Shanghai Stock Exchange 300, Shanghai Stock Exchange 500 and Growth Enterprise Market Index (the data of Shanghai Composite Index and Shenzhen Stock Exchange Index since 2002, and the data of other indexes since their release), it can be found that the current valuation levels of each index are in a low position: the PE of Shanghai Stock Exchange 50 and Shanghai Stock Exchange Index are 10% and 12% respectively; The PE of Shanghai and Shenzhen 300 and Shenzhen Component Index are relatively high, accounting for 25% and 30% respectively in history. CSI 500 and GEM refer to PE at the bottom of history.
PB of main index of A shares:According to PB data, the indexes are also at historical lows. The PB of Shanghai Composite Index, Shenzhen Component Index, Shanghai 50, Shanghai and Shenzhen 300, CSI 500 and Growth Enterprise Market Index are located at 1%, 9%, 0%, 15%, 1% and 13% respectively in history.
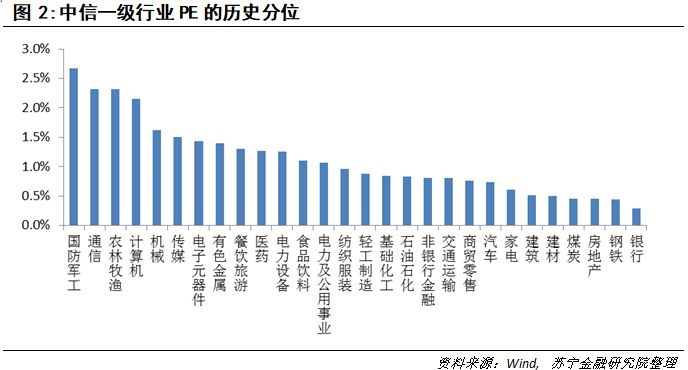
CITIC’s first-class industry PE (see Figure 2):PE valuation of all industries is at the bottom of history. Among them, the PE level of defense, military industry, communication, agriculture, forestry, animal husbandry and fishery industries is relatively high, but it only exceeds the historical 2.7%, 2.3% and 2.3%, while the PE valuation of banks, steel, real estate, coal and other industries with relatively low PE level has not reached the historical level of 0.5%.
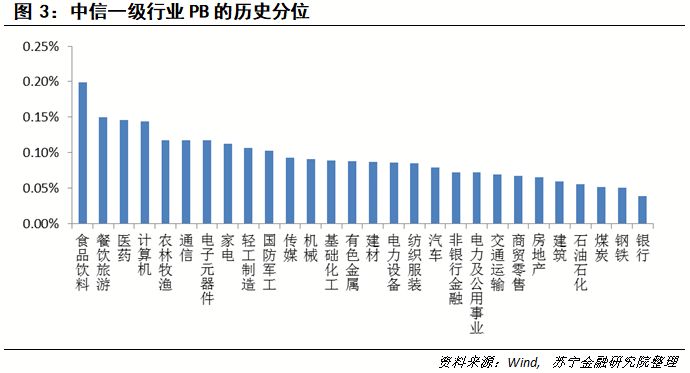
PB of CITIC’s Tier 1 industry (see Figure 3):Compared with PE, the historical percentage of PB in CITIC’s tier-one industries is relatively lower, and the PB valuation of food and beverage, catering tourism and pharmaceutical industries with higher rankings has not exceeded the historical 0.2%, and all PB levels are at the bottom of history.
On December 26, 2018, the PE of S&P 500 was 18.70, the PE of Hang Seng Index was 9.53, and the PE of Shanghai and Shenzhen 300PE was 10.22. The PE of Nasdaq is 39.9, while that of GEM is 28.2. Therefore, from the horizontal comparison, the valuation of A shares is close to the level of global valuation of Hong Kong stocks.
Performance: both year-on-year and quarter-on-quarter declines.
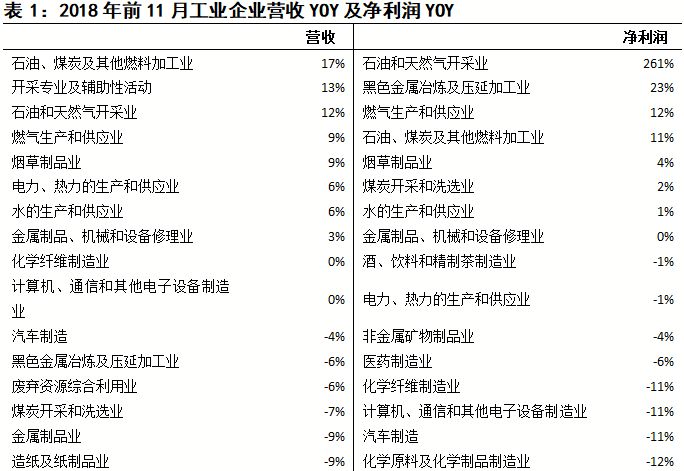
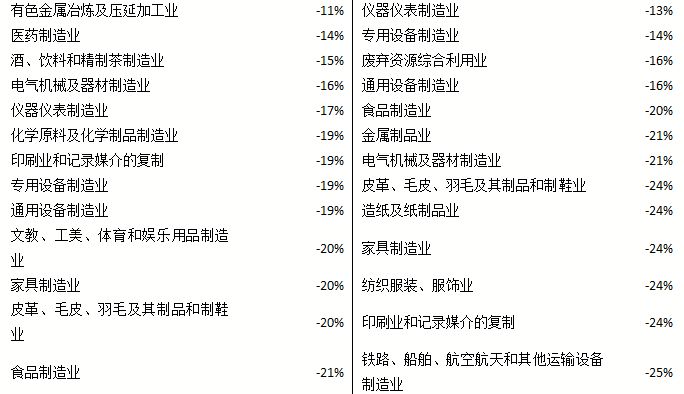
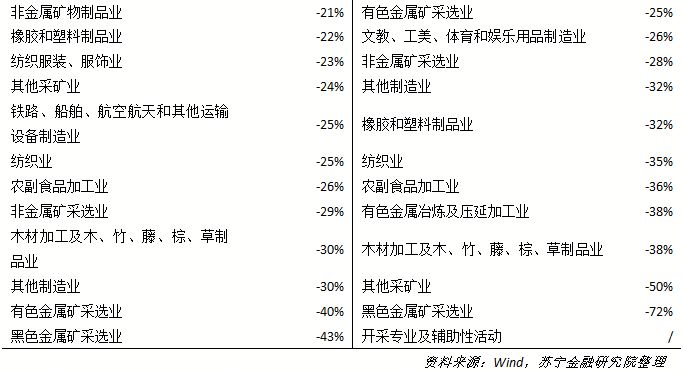
Since the A-share annual report has not been published, we use the data of the National Bureau of Statistics to look at the revenue and net profit by industry (see Table 1). In terms of revenue, about 80% of the industries’ revenue growth rate is negative year-on-year. Among them, only the YOY of oil, coal and other fuel processing industries, mining professional and auxiliary activities, and oil and gas mining industries exceeds 10%, with year-on-year growth rates of 17%, 13% and 12% respectively, while the operating income of non-ferrous metal mining and dressing industries and ferrous metal mining and dressing industries has dropped significantly year-on-year, dropping by 40% and 43% respectively.
From the perspective of net profit, the growth rate of net profit of over 80% of industries is negative, among which the net profit of ferrous metal mining industry and other mining industries has fallen by a large margin, down by 72% and 50% respectively.
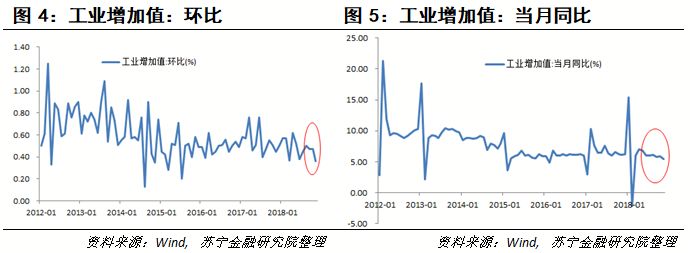
From the perspective of industrial added value, both the year-on-year growth rate and the chain growth rate have declined. In November 2018, the growth rate of industrial added value was 0.36% (see Figure 4), the lowest since August 2015. In November 2018, the year-on-year growth rate of industrial added value was 5.4% (see Figure 5), the lowest since March 2018, and it also showed a downward trend.
Capital: overall substantial net outflow, net inflow of foreign capital.
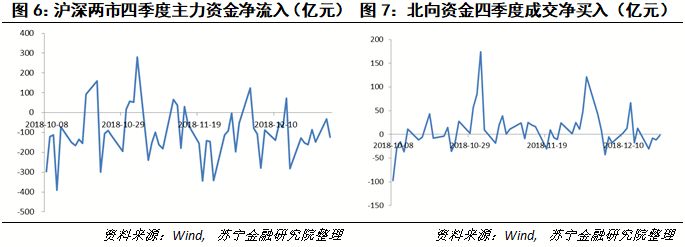
Investigating the daily main capital flow of Shanghai and Shenzhen stock markets since 2018, it is found that the main capital of Shanghai and Shenzhen stock markets is mainly in the state of capital outflow. According to the statistics of capital flow in the fourth quarter of 2018, it is found that over 80% of the time, A shares in Shanghai and Shenzhen stock markets are in a state of net outflow of main funds. In the fourth quarter of 2018, the net outflow of A shares in Shanghai and Shenzhen stock markets exceeded 600 billion yuan (Figure 6).
Judging from the flow of funds northward, most of the time the funds are in a state of net inflow. In the fourth quarter of 2018, the net purchase of northbound funds was about 60 billion yuan (Figure 7). Although it was in a state of net inflow, it was significantly lower than the net purchase of 81.5 billion yuan in the third quarter.
Market sentiment: trading is sluggish.
We measure the market sentiment of A shares from three aspects: trading behavior, index products and the views of market participants.
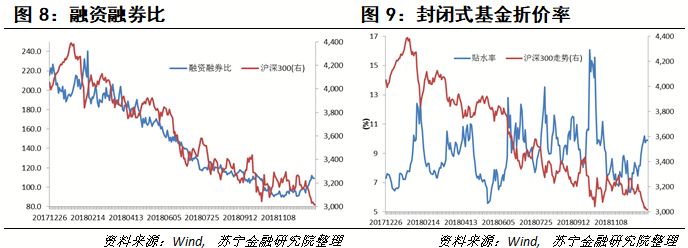
Margin ratio is an important indicator to observe market sentiment from the perspective of trading behavior. Since the end of January 2018, the margin ratio has been declining all the way, and it was not until December that the downward trend was changed. Since December 2018, the ratio of margin financing to securities lending has shown a slight upward trend (see Figure 8).
From the perspective of index products, since 2018, the discount rate of closed-end funds has been positive and shows a fluctuating upward trend (see Figure 9). By mid-October, the discount rate reached the highest level. At present, the discount rate has declined from October and remained at around 10%.
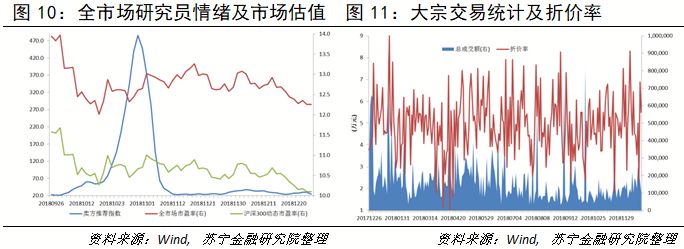
Among many market participants, we choose the most rational data of two types of participants (researchers and block traders) to observe investor sentiment (see Figure 10 and Figure 11). Judging from the seller’s recommendation index, the seller’s recommendation index in the fourth quarter reached the top of nearly three months at the end of October, and after October, the seller’s recommendation index showed a straight decline and is still at a low level. From the perspective of bulk transactions, the current transaction volume has slightly increased compared with the third quarter, and the discount rate has dropped first and then increased.
2018 Trend Summary and 2019 Prospect
Looking higher, we believe that the downturn of A shares in 2018 is inseparable from the overall macroeconomic situation.
Affected by factors such as deleveraging, the performance of industrial enterprises declined in 2018, and the year-on-year growth rate declined. Coupled with external factors such as trade frictions and the Fed’s interest rate hike, A-share confidence was insufficient, and funds in Shanghai and Shenzhen stock markets flowed out significantly. The main indexes of A-shares and industry valuation are also at a historically low level.
Looking forward to 2019, we believe that the three carriages (export, investment and consumption) that drive the economy will show this trend with great probability:
(1) Exports will fall back, mainly due to the impact of international trade and the economic slowdown in Europe and America, so we need to focus on the progress and results of Sino-US trade negotiations.
(2) Real estate investment in fixed investment will fall back, but the possibility of loosening the strict control policy on real estate will not be ruled out; Infrastructure will increase slightly, but the extent is limited, mainly depending on whether the space of China’s monetary policy can be opened with the peak of the US interest rate hike cycle, and whether the central and local governments can break through the debt ceiling.
(3) Consumption may improve slightly, which mainly depends on the influence of the leverage of the residential sector. In addition, the policies that may have a general and long-term impact on the macro-economy are tax reduction, fee reduction and the principle of competition neutrality of state-owned enterprises. If the above two policies can make substantial progress beyond expectations, it will greatly boost investors’ mood and fundamentally change the fundamentals of the macro-economy.
In general, it is expected that the probability of market volatility bottoming out in the first half of 2019 is high, and the positive effect of follow-up policies on the stock market remains to be seen. Investors should be alert to the risks brought by market fluctuations. (This article does not constitute any investment advice)
"
More exciting content, pay attention to titanium media micro-signal (ID: taimeiti), or download titanium media App.
"
